Drop in a general ledger export from Xero, QuickBooks Online, Sage 50 or Pandle, or open an IQ Books ledger live. LedgerIQ draws up the statements, puts a financial dashboard on top, runs the financial statement analysis across 44 modules and writes the board pack, with every figure traced back to the transactions.
44 analysis modules1,000 credits a full analysis4 platforms CSV or Excel GL
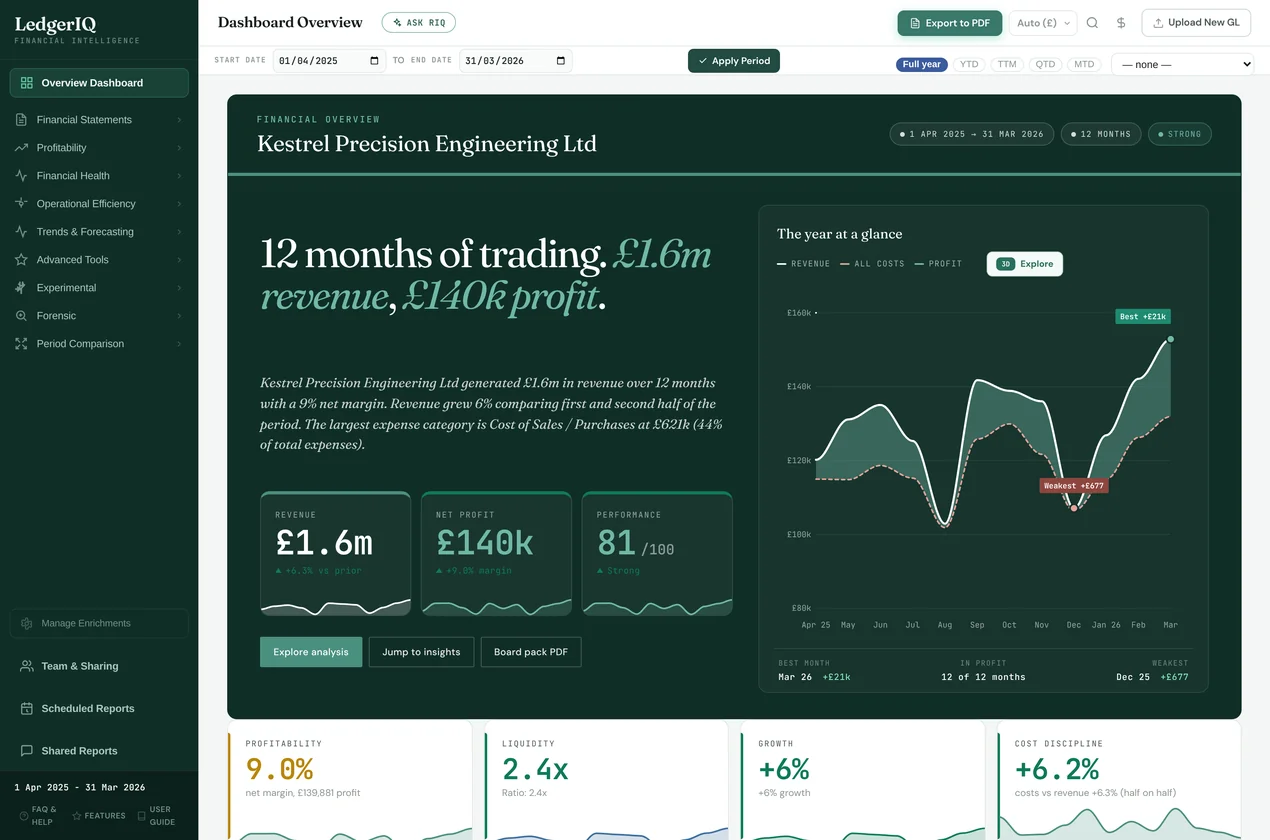
LedgerIQ · Dashboard overview
A sample financial dashboard: the overview on a demo company's ledger
01 · The input
The general ledger, not a trial balance.
A trial balance gives you closing balances. The general ledger gives you every transaction behind them, which is what seasonality, anomalies, expense correlation and a drill-down need. LedgerIQ takes the ledger and builds the trial balance itself.
Four systems' exportsA general ledger export as CSV or Excel from Xero, QuickBooks Online, Sage 50 or Pandle, each recognised by its layout.
Or live from IQ BooksNo export at all, and the thirteen-week cash calendar and credit control come with it.
Any chart of accountsEvery account is classified into its place in the statements: current or fixed assets, current or long-term liabilities, equity, revenue, cost of sales, overheads. Where an account name is ambiguous, LedgerIQ asks, and every answer can be changed.
Your year endSet the financial year start and every comparison, trend and period respects it.
Opening balancesDetected and carried into the balance sheet, so the trial balance balances and the profit and loss isolates the period.
No connection neededIt works from the export, so there is nothing to authorise and it runs on a client you have not onboarded.
General ledger · classifiedGL export
Account
Statement line
4000 Sales · UK
→
Revenue
5010 Materials
→
Cost of sales
7100 Rent
→
Overheads
0030 Plant & machinery
→
Fixed assets
2310 Bank loan
→
Asked: due within a year?
1100 Trade debtors
→
Current assets
Trial balanceDebits = credits
02 · The contents
Forty-four modules, one upload.
A reporting tool can stop at a profit and loss. LedgerIQ's contents run from the statements through ratios, trends and forecasts to valuation and forensic tests, and work as a financial KPI dashboard you can set targets and alerts against. Every module is interactive, exportable and explained in plain English.
Financial statements S
Profit and loss S1
Balance sheet S2
Cash flow statement S3
Changes in equity S4
Trial balance S5
Common-size profit and loss S6
Common-size balance sheet S7
Profitability P
Margin analysis P1
Break-even and CVP P2
Revenue insights P3
Expense structure P4
Return ratios (ROA, ROE, DuPont) P5
Financial health H
Liquidity overview H1
Working capital H2
Cash conversion cycle H3
Debt and leverage H4
Receivables and payables H5
Trends and forecasting T
Profit and loss trends T1
Balance sheet trends T2
Ratio trends T3
Seasonality T4
Revenue forecasting T5
Cash flow forecast T6
Budget builder T7
Budget against actual T8
Advanced tools A
Transaction anomalies A1
P&L scenario builder A2
Three-way forecast A3
What-if impact A4
Targets and alerts A5
Valuation and risk V
Financial health scoring V1
Credit risk and lending V2
Tax efficiency V3
Capital structure V4
Business valuation V5
Forensic F
Examination pack F1
GL integrity audit F2
Reclassification audit F3
Beneficiary attribution F4
Personal-use detection F5
Inter-entity flow F6
Loan and credit timeline F7
Source-of-funds tracing F8
Audit exhibits F9
Forty-four modules, grouped by topic. The dashboard also carries operating and custom KPIs, expense correlation, period comparison and more.
03 · The financial dashboard
One screen, then the detail behind it.
The overview is a financial dashboard of the year: revenue, net profit and a performance score, then profitability, liquidity, growth and cost discipline, each with its trend. Click any figure to open the module behind it, and drill from a total to the entries that make it up.
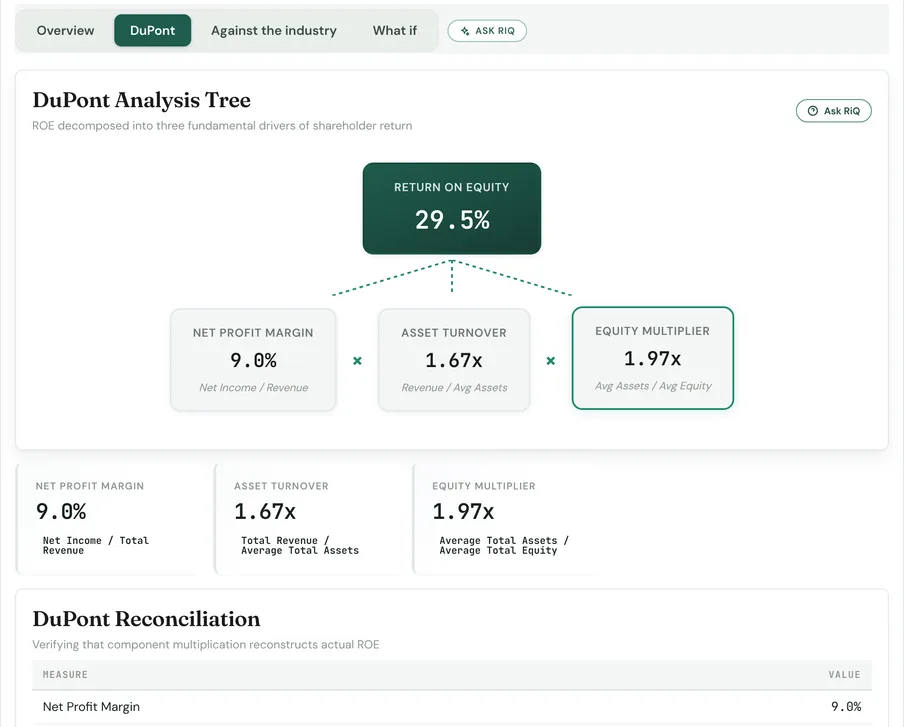
LedgerIQ · Return ratios
Return ratios: the DuPont breakdown, reconciled back to return on equity
Period controlsFull year, year to date, trailing twelve months, quarter or month to date, or any dates you choose.
Drill downFrom any total to the accounts, and from the accounts to the transactions.
Health scoresAltman Z-score and Piotroski F-score alongside the ratios, in the financial health scoring module.
Charts you can take awayEvery chart downloads as a PNG or SVG image, or as its data in CSV.
04 · Financial statement analysis
Horizontal, vertical and ratio analysis.
Analysis of financial statements comes down to three methods used together. LedgerIQ is financial statements analysis software that runs all three on the same ledger, so the comparisons always agree with the statements. Financial statement analysis programs built on spreadsheets drift from the books over time; financial statement analysis software that starts from the ledger cannot. The common ratios, each with its formula, a worked example and the LedgerIQ module that calculates it, are in the financial ratios formulary.
Horizontal analysisEach line against earlier periods, a comparative financial statement analysis of growth, drift and the month something changed. The trend modules, and period comparison (with a second ledger upload).
Vertical analysisEach line as a share of a base: revenue for the profit and loss, total assets for the balance sheet. The common-size statements.
Ratio analysisLines related to each other: liquidity, gearing, returns, margins, efficiency and the cash conversion cycle. The ratio modules, with each formula shown.
Common-size P&LDemo company · 12 months
Line
£
% of revenue
Revenue
1,562,429
100.0%
Cost of sales
(778,672)
49.8%
Gross profit
783,757
50.2%
Operating expenses
(580,192)
37.1%
Operating profit
203,565
13.0%
Interest and tax
(63,684)
4.1%
Net profit
139,881
9.0%
05 · Forecasts and valuation
What happens next, and what it is worth.
The same ledger drives the forward-looking modules. Each shows its method and its range, so a forecast or a valuation arrives with the assumptions behind it rather than a single confident number.
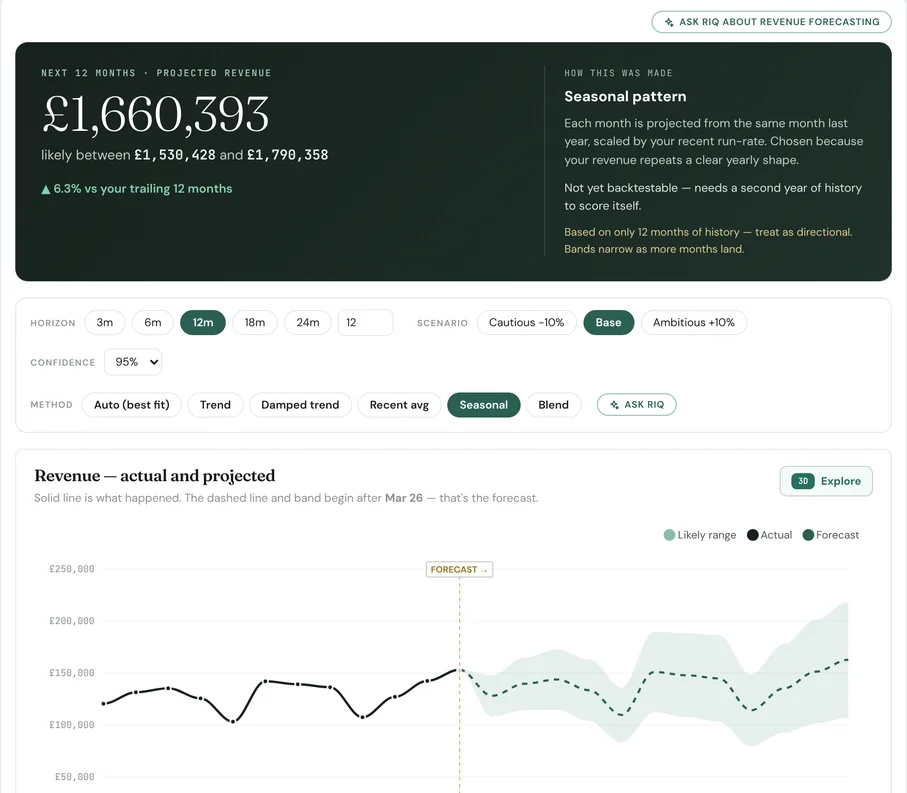
LedgerIQ · Revenue forecasting
Revenue forecasting: method, range and scenario chosen in view
Revenue forecastingTrend, damped trend, recent average, seasonal or a blend, with a confidence band and cautious, base and ambitious scenarios.
Cash flow forecastThree, six or twelve months ahead, downloadable as an Excel workbook, plus a three-way forecast. On an IQ Books ledger, a thirteen-week cash calendar as well.
Budget against actualSet a budget and see the variance by line and by month.
Break-even and what-ifThe break-even point, the margin of safety and what a price or cost change does to profit.
Business valuationSix valuation methods and a Monte Carlo simulation of 10,000 runs, so you see a range and its assumptions. For a quick estimate, try the free business valuation calculator.
06 · The examination pack
Every transaction examined, working paper included.
For independent examinations, review engagements and pre-audit work: analytical procedures over every transaction in the ledger, set out as numbered exhibits with clear verdicts and exported as a print-ready working paper with a sign-off block. It runs in your browser.
Around it sit eight forensic modules: GL integrity audit, reclassification audit, beneficiary attribution, personal-use detection, inter-entity flow, loan and credit timeline, source-of-funds tracing and audit exhibits.
Digit testsBenford first-two-digit conformity with MAD bands, the summation test, and the relative size factor for decimal-shift and keying errors.
DuplicatesExact, cross-account and near-duplicate payments.
CompletenessA recurring-commitment register, and the payment that is missing from it; price creep hiding inside flat-looking category totals.
ConcentrationCustomer and supplier dependence by HHI, Gini and top share; period-end and weekend posting.
SamplingMonetary unit sampling, seeded and reproducible, with a CSV export.
The working paperPopulation, procedures and exceptions, an agreed-to-evidence column and prepared-by and reviewed-by sign-off. Verdicts prompt enquiry; they are not opinions.
07 · RiQ
Ask the books a question, get the working.
RiQ, the ReconcileIQ assistant, makes LedgerIQ an AI financial analysis tool without letting AI near the arithmetic. Ask in plain English and it opens the right module, explains the figures and writes the narrative. The numbers come from the modules' calculations; RiQ explains them, it does not make them up.
Explains any moduleMargins, cash conversion, gearing, break-even: what the figure is, what moved it and what to look at next.
Drives the dashboardOpens modules, changes the period and filters on command.
Writes the reportA business report and the board pack narrative, from the figures on screen.
Guides the set-upWalks through the account classification questions in plain English.
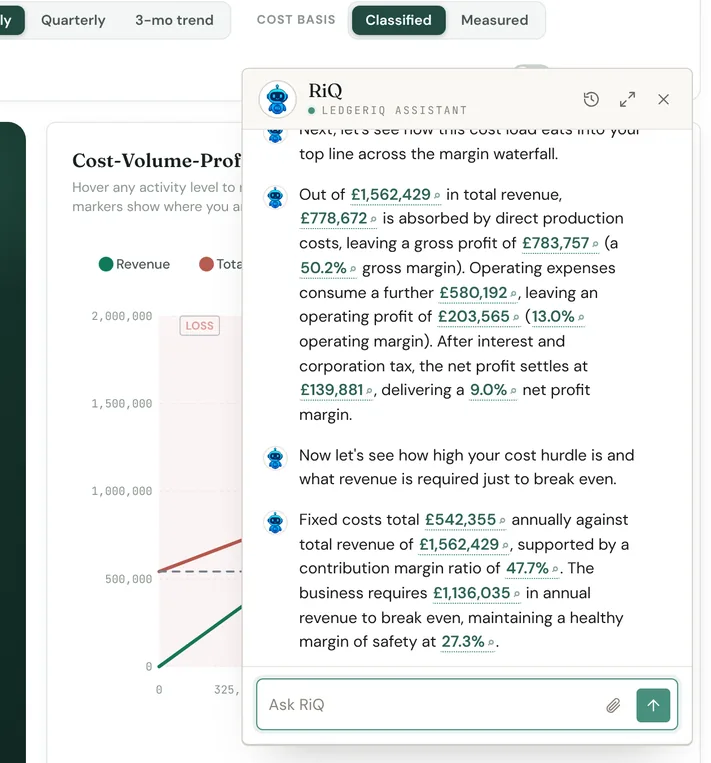
LedgerIQ · RiQ
RiQ walking through the margin waterfall and break-even
08 · Financial reporting
Board packs, decks and reports that send themselves.
The report composer is LedgerIQ's financial reporting tool and its board pack software: pick charts, tables, KPIs and commentary from any module, put them in your brand, and export as PDF, PowerPoint, Word, Excel or CSV, share as a web link, or schedule. Practices can keep a brand profile for each client.
Board pack · FY
The year in brief
Revenue grew 6% on the first half and the net margin held at 9.0%. Cost of sales takes 49.8% of revenue; liquidity is comfortable at 2.4 times.
Revenue£1.6m
Net profit£140k
Liquidity2.4×
Prepared by your firmPage 2
PDFComposed report
Your logo, company name, colours, fonts and cover layout, saved as profiles for the firm and for each client.
PDFBoard pack
The statements, the key ratios, the risks flagged and a written narrative of the period, from the dashboard in one click.
PowerPoint · Word · Excel · CSVThe same report, editable
The composed report as a PowerPoint deck or a Word document with the same cover, sections and charts, or as an Excel workbook (a sheet a section) or a CSV.
ScheduleScheduled reports
Daily, weekly or monthly delivery to the recipients you choose.
Web linkShared reports
Send a report as a web link, open to anyone with it or private to a client's portal; comments come back to the firm to resolve.
TeamFirm workspace
Admin, staff and client roles sharing one report library, branding and schedules.
09 · Privacy and credits
Analysed in your browser, priced per analysis.
The ledger file is read and analysed in your browser, and detailed transaction data is not kept beyond the session unless you save a snapshot. Reports you render, schedule or share go to our servers to be built and delivered, encrypted with AES-256. When you ask RiQ a question, or it writes a narrative or checks an account classification, the figures and account names it needs are sent to our servers too.
1,000credits a full analysis
0credits to reopen the same period in the session
1full analysis on the free tier's 1,000 credits, no card
5analyses a month on Starter, £5 for 5,000 credits
Questions
Financial reporting, answered.
What people search for about financial reporting software and financial statement analysis, plus the questions we hear about LedgerIQ. More in the LedgerIQ FAQ.
What is financial reporting software?
Financial reporting software turns accounting records into the reports people actually read: the profit and loss, the balance sheet and the cash flow statement, plus the ratios, trends and commentary that explain them. Some tools sit on a live accounting connection; LedgerIQ works from a general ledger export from Xero, QuickBooks Online, Sage 50 or Pandle, or reads an IQ Books ledger live, and turns the result into a PDF board pack, or a composed report in PDF, PowerPoint, Word or Excel.
What kinds of financial reports are there?
Broadly three. The statutory financial statements (profit and loss, balance sheet, cash flow statement, statement of changes in equity and the notes) are prepared to an accounting standard and filed. Management reports are internal, as frequent as you like, and built for decisions: margins, cash, working capital, budget against actual. Board and lender reports package both with a narrative. LedgerIQ draws up the statements, runs the management analysis and writes the board pack from one general ledger.
What is the difference between financial accounting and financial reporting?
Financial accounting is the recording: every transaction posted to the ledger under the double-entry rules. Financial reporting is what comes out of it: the statements and analysis presented to owners, boards, lenders and HMRC. LedgerIQ sits on the reporting side. It reads the ledger your accounting software keeps and reports on it; it does not post entries.
What tools are used for financial analysis?
Most analysis still starts in a spreadsheet or the accounting software's own reports. Dedicated financial analysis software programs add the ratios, trends, forecasts and narrative a spreadsheet makes you build by hand each month; tools such as Fathom and Syft do this from a live accounting connection. LedgerIQ does it from the transaction-level general ledger export: 44 modules, a financial dashboard and a written board pack. See the Fathom alternatives comparison for how the options differ.
Can you do financial modelling in Excel?
Yes, and many models live there. The hard part is feeding them: rebuilding the profit and loss and balance sheet from a ledger export every month. LedgerIQ does that part. Any report you compose exports as an Excel workbook, with a sheet for each section; modules such as the cash flow forecast also have their own Excel download, and every chart's data downloads as CSV, so your own model can start from figures that already tie to the books.
What is the best financial reporting software for a small business?
The one that reports on the books you already keep without a rebuild. For a small business that usually means three things: it reads your accounting system's data without an expensive integration, it explains the figures in plain English, and it costs per use rather than per company per month. LedgerIQ reads a general ledger export from Xero, QuickBooks Online, Sage 50 or Pandle, explains every module, and charges 1,000 credits a full analysis, with a free tier that covers the first one.
Can I build a financial dashboard in Excel?
Yes: a summary sheet of key figures with charts fed from the ledger, refreshed each month by pasting in a new export. It works until the chart of accounts changes or someone asks a question the sheet was not built for. LedgerIQ's financial dashboard is built from the same export with nothing to maintain, and its chart data downloads as CSV if you still want the figures in Excel.
Is AI replacing financial analysts?
It is replacing the slow parts: assembling the figures, calculating the ratios and drafting the first commentary. The judgement is still a person's. In LedgerIQ the numbers are calculated from the ledger by the modules, not by a language model, and RiQ writes its explanation on top of those calculated figures, so an analyst spends the time on what the numbers mean.
What is a financial dashboard?
A financial dashboard puts a business's key figures on one screen, so you can see how it is doing without opening every report. LedgerIQ's overview dashboard shows revenue, net profit and a performance score, then profitability, liquidity, growth and cost discipline, each with its trend, and opens into the module behind any figure. It is built from the general ledger, so every number ties back to transactions.
How do you do a financial statement analysis?
Use three methods together. Horizontal analysis compares each line with earlier periods to show growth and drift. Vertical analysis expresses each line as a percentage of a base, revenue for the profit and loss and total assets for the balance sheet, so businesses of different sizes compare. Ratio analysis relates lines to each other: liquidity, gearing, returns, margins and efficiency. LedgerIQ runs all three from one general ledger: period comparisons and trends, common-size statements, and the ratio modules.
What is vertical analysis of financial statements?
Vertical analysis states every line as a percentage of one total in the same statement: each profit and loss line as a share of revenue, each balance sheet line as a share of total assets. It shows the shape of a business at a glance, for example that cost of sales takes half of revenue, and lets you compare a year with the last, or one company with another of a different size. LedgerIQ's common-size profit and loss and common-size balance sheet are vertical analysis, calculated for you.
Does LedgerIQ need a trial balance or the general ledger?
The general ledger, at transaction level. A trial balance is a set of closing balances: it can produce a balance sheet but it cannot show seasonality, expense correlation, anomalies or which entries make up a figure. LedgerIQ builds the trial balance itself from the ledger, then runs every module on the transactions underneath.
Which accounting software does it work with?
Xero, QuickBooks Online, Sage 50 and Pandle, from a general ledger export (also called the nominal ledger, account transactions or GL detail) as CSV or Excel. LedgerIQ recognises each by its layout and asks a few questions about how ambiguous accounts are classified. Exports from other systems are not yet recognised. An IQ Books ledger is read live, with no export. It works from the export rather than a live connection, so there is nothing to authorise and it runs on a client you have not onboarded.
Can it produce consolidated reports for a group?
No. LedgerIQ analyses one ledger at a time, so it is not consolidated financial reporting software. Run each company's ledger separately; it does not eliminate intercompany balances or combine entities.
What formats can I export the analysis in?
The report you compose from any module's charts, tables and commentary, in your own branding, exports as a PDF, a PowerPoint deck, a Word document, an Excel workbook with a sheet for each section, or a CSV, or goes out as a web link or on a schedule. There is also a PDF board pack from the dashboard, Excel downloads inside modules such as the cash flow forecast, and any chart as a PNG or SVG image or its data as CSV.
How much does LedgerIQ cost?
A full analysis is 1,000 credits, and reopening the same period in the same session is free. The free tier is permanent, with 1,000 one-off credits and no card, which covers one full analysis. Starter, at £5 a month, adds 5,000 credits a month, enough for five. See pricing.
Is my general ledger uploaded to your servers?
The ledger file is read and analysed in your browser. Detailed transaction data is not kept beyond the session unless you save a snapshot. Reports you choose to render as PDF or PowerPoint, schedule or share are sent to our servers to build and deliver them, encrypted with AES-256, and when you ask RiQ, or it writes a narrative or checks an account classification, the figures and account names it needs are sent too.
Before the analysis.
LedgerIQ is one of five ReconcileIQ products. The other four get the ledger ready for it, or hold it: